During this year’s election season in France, media attention was focused on the results of the municipal elections in the major cities, which were viewed as potential electoral flashpoints. With the exception of Paris, Lyon and Marseille, where coverage sometimes considers the social divisions between these cities’ arrondissements (administrative districts), [1] large cities are usually treated in an all-encompassing, uniform manner, as if they were homogeneous units. The social contrasts that in fact structure these cities at intra-urban level are completely lost. Furthermore, in the dominant representations, these cities are considered to be uniformly populated by “bobos” (bourgeois bohemians) whose political persuasions – close to the Socialist Party (Parti socialiste) and the Greens (Europe Écologie – Les Verts) – would appear to explain the success of the municipal coalitions that govern them. In reality, though, these representations are erroneous and dangerous, both socially and politically.
First, the “bobo” category conveys a “pernicious vision of the social world and its divisions” (Tissot 2013), and it is no coincidence that this journalistic term – typically used to designate gentrifiers – first made its appearance after Paris and Lyon city councils swung to the left in 2001, and then spread as other cities, such as Toulouse or Strasbourg, also voted in socialist mayors in 2008. As early as 2001, this vision was expounded in an article in left-leaning daily Libération, titled “Municipales, les bobos vont faire mal” (“Municipal elections : the bobo vote will hurt”, 8 January 2001), by Christophe Guilluy, now best known for his commitment to putting the issues of periurban areas on the political agenda (Girard and Rivière 2013) – a strategy that has had the effect of relegating the issues of large social-housing estates in the inner suburbs to the background of the public debate (Rivière and Tissot 2012). And yet these representations of spaces in urban cores and on the urban fringes are pieces of the same puzzle, which expresses the question of social class and divisions in new terms : “Petits Blancs contre bobos, la nouvelle lutte des classes ?” (“Low-income whites versus bobos : the new class struggle ?”, Le Figaro, 13 February 2014).
This way of seeing things is today gaining ground and can be found – in more or less significant forms – in the national and regional press, in the speeches of certain politicians and local-government stakeholders, and even in some academic circles. To help deconstruct this simplistic interpretation of the dynamics at play in urban contexts, this article offers an analysis of the contrasts that were present in French cities with more than 200,000 inhabitants at the time of the 2008 municipal elections. [2] By examining data at the level of individual polling districts (which have an average population – voters and non-voters combined – of around 2,000), it shows that French intra-urban contexts form a social mosaic, the electoral effects of which are more complex than the dominant representations would suggest. [3]
Taking account of the variety of voting options : a methodological challenge
The comparative approach adopted is hampered by the fact that the 11 cities studied – Paris, Lyon, Marseille, Toulouse, Nice, Nantes, Strasbourg, Lille, Bordeaux, Montpellier and Rennes – did not present the same “electoral offer” during the first round of municipal elections. The number of party lists ranged from 7 in Rennes to 11 in Strasbourg, and even more if we take into consideration the specific offers in each arrondissement of Paris, Lyon and Marseille. [4] After grouping these lists, eight categories of electoral behaviour can be identified for analytical purposes : (1) abstention ; (2) casting a blank ballot ; (3) casting a spoiled ballot ; (4) voting for far-left parties ; (5) voting for mainstream left-wing parties, including the Socialist Party (Parti socialiste, PS), the French Communist Party (Parti communiste français, PCF), divers gauche (DVG, i.e. other, non-specific left), and the Green Party (Europe Écologie – Les Verts, EE-LV) ; (6) voting for the Democratic Movement (Mouvement démocratique or Modem, the main centrist/centre-right party) ; (7) voting for mainstream right-wing parties, including the Union for a Popular Movement (Union pour un mouvement populaire, UMP), the New Centre (Nouveau Centre, NC), and divers droite (DVD, i.e. other, non-specific right) ; and finally, (8) voting for far-right groups such as the National Front (Front national, FN). [5]
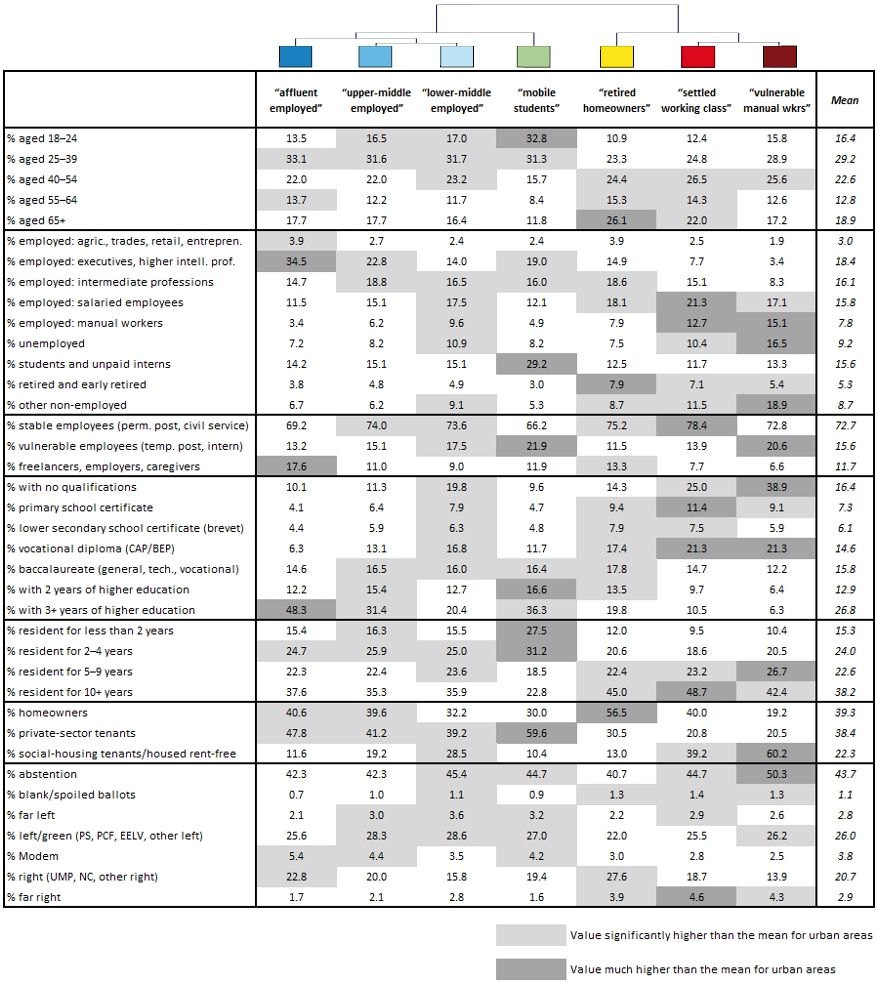
Given that not all political parties and groups were represented in each city, a typology was developed on the basis of the sociological profile of residents (defined by their age, their level of education, their socio-professional status within the population aged 15 to 64, the nature of their employment contract for those in employment, the length of time they have lived in the area, and the nature of their housing tenure). The aim of this typology was to help identify seven groups of polling districts. [6] The electoral profile of each group was then established : the maps below show their distribution across each of the cities, while the table in the annex presents a detailed description of their characteristics. While this approach has the advantage of providing a common overview of France’s major cities, it also has the disadvantage of “averaging out” the relationships between a neighbourhood’s social profile and its voting tendencies, which may be quite different – even diametrically opposed – from one city to another.
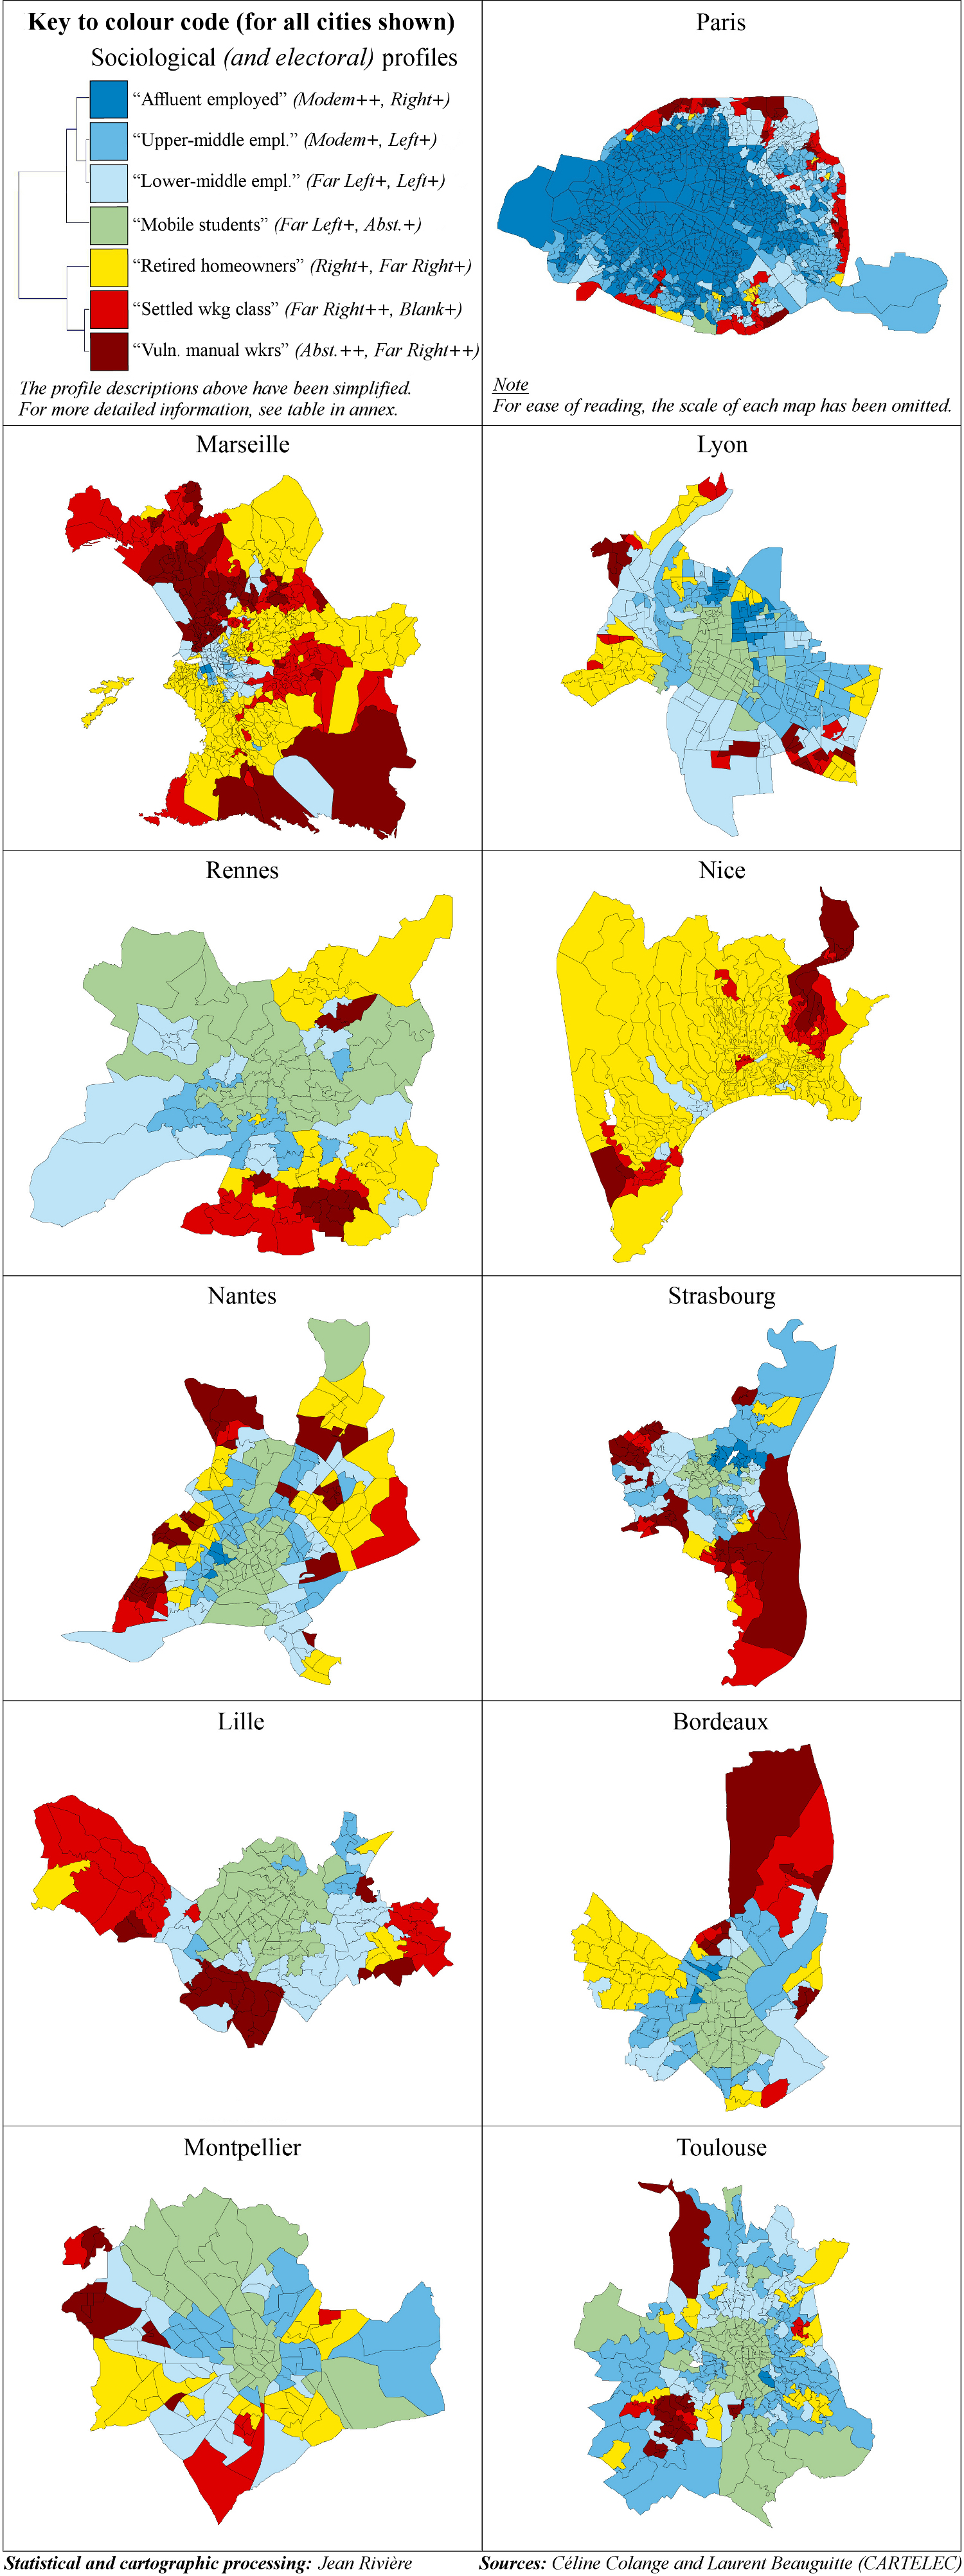
Dominant social groups – urban cores – core voting trends
The first branch of our typology comprises four groups of polling districts where registered voters are relatively young and well positioned in terms of social status. This is particularly the case of the “affluent employed” category, which covers central and western Paris, the bourgeois 6th arrondissements of Lyon and Marseille, and a few polling districts in the smart neighbourhoods of Strasbourg, Nantes and Bordeaux. This profile is characterised by a significant over-representation of executives (35%, more than twice the average proportion of this category in the populations of the cities studied), freelance workers (4%), residents with at least three years of higher education, and private-sector tenants. In electoral terms, this translates into greater support for Modem candidates than in other areas (5% of registered voters) and, more generally, for right-wing lists centred on the UMP (23%, compared with an average of 21%). [7]
In most of the cities studied, these areas border “upper-middle employed” polling districts, typically located in residential areas close to the city centre, as is the case in Rennes, Nantes, Bordeaux, Montpellier and Toulouse. These intra-urban spaces – well-off, but less so than the “affluent employed” category – are inhabited in particular by people aged 18 to 39 who work as executives (23%) or in intermediate professions (19%), often with stable work contracts and university qualifications. They are more likely than average to have lived in their neighbourhood for less than five years. Politically, these districts lean towards Modem (4%) and joint Socialist–Green party lists (28%).
Polling districts in the “lower-middle employed” category are geographically and socially similar to the previous two categories (especially in the east of Paris), but are situated a little lower down in the hierarchy. Their inhabitants are usually aged between 18 and 54, with more intermediate professions (17%), salaried employees (18%) and even manual workers, greater numbers of residents whose highest qualification is the baccalaureate (obtained at age 18) or vocational diplomas such as CAPs (certificats d’aptitude professionnelle) and BEPs (brevets d’études professionnelles), and greater numbers of tenants who arrived in the area in the last 5 to 10 years. This sociological and urban mosaic is the category most favourable to the left (a third of those registered to vote) as it is here that far left parties obtain their best relative scores (4%), as do the Socialists and the Greens (29%, compared with an average of 26%). Abstention here is a little higher than elsewhere (45%).
Polling districts in the heart of the city centre – and in particular in Montpellier, Toulouse, Nantes and Rennes – tend to belong to the “mobile student” category. The number of 18-to-24-year-olds is very high (a third of all adult residents), especially as this age group includes a significant concentration of students, although executives and intermediate professions are not under-represented – with the result that over half of the population has completed at least two years of higher education (a rate 15 percentage points higher than the average for the cities studied). Nearly 60% of residents of these neighbourhoods are private-sector tenants and have lived in the area for less than five years, implying a high residential turnover. In 2008, the voting trends in these areas were close to the mean for urban areas, albeit with a few more votes than elsewhere for joint Socialist–Green lists (27%, compared with 26% on average).
Dominated social groups – urban fringes – fringe voting trends
The second branch of the typology comprises three categories whose inhabitants are typically aged over 40 and often belong to the working classes. Polling districts in the “retired homeowners” group are found in two main locations : in the Mediterranean cities of Nice and Marseille on the one hand, and in areas midway between the wealthy and working-class neighbourhoods of other cities on the other. In this group, 40% of residents are aged over 55, and residents in active employment tend to occupy positions in the middle of the social space (intermediate occupations, salaried employees). The proportion of homeowners is high (55%), as is the proportion of residents who have lived in the area for over 10 years (45%). Probably due to a cohort effect – namely a socialised expectation to turn out to vote – it was in these districts that abstention rates were lowest in 2008 (although still 40%) and that lists led by UMP (28%), and secondarily by far-right groups (4%), obtained their best scores.
The last two profiles designate urban spaces occupied by different fractions of the working classes. The “vulnerable manual workers” group corresponds to large social-housing neighbourhoods in most of the cities studied, such as the belt of social housing along most of the Paris city boundary, Marseille’s “Quartiers Nord” (“Northern Districts”), the Neuhof area of Strasbourg, or Le Mirail in Toulouse. Adults who are retired or unable to work (19%) and unemployed adults (16%) are strongly over-represented. Those residents in employment typically occupy insecure jobs (i.e. with fixed-term or temporary contracts), and are frequently manual workers. The proportion of social housing tenants is around 60%, and 70% of residents have lived in the area for more than five years. All these factors point towards the “democracy of abstention” (Braconnier and Dormagen 2007). Indeed, the average abstention rate for this category was 51% at 2008 elections, peaking at 71% in one polling district of the 9th arrondissement of Lyon. [8] Those who did go out to vote were a little more likely to vote for far-right lists than in other areas (4%, compared with 3% on average).
Finally, the polling districts in the “settled working-class” category are located in the immediate vicinity of the previous districts. They are home to greater numbers of residents over 40, while salaried employees (21%) and manual workers (13%) are the dominant socio-professional categories among those inhabitants who are employed (80% of whom with stable work contracts). It is, moreover, in these neighbourhoods that residential stability is highest (almost half of residents have lived in the area for over 10 years), and homeowners and social-housing tenants are present in equal measures. In these intra-urban areas surrounding large social-housing estates, abstention rates (45%, compared to 44% on average) and numbers of blank/spoiled ballots are slightly over-represented, as are votes for far-right lists (5%, compared with 3% on average).
Correlations between voting trends and social structures specific to each urban context
Although the categories detailed above helped to establish correspondences between the geography of social inequality and electoral outcomes, we might have expected the observed contrasts to be more distinct from a quantitative point of view (see table in annex). Here, it must be remembered that the electoral profiles of these seven groups were established on the basis of percentages of registered voters, and not on the basis of percentages of votes cast. Given that the average abstention rate was 44%, the contrasts between results for party lists are necessarily tempered. Table 1 below summarises some of the key statistical correlations and highlights the variations between cities.

Interpretation : A positive coefficient indicates that the number of votes for the list in question tends to increase in direct proportion to the presence of a particular socio-professional category in the population (e.g. executives). The closer the coefficient is to 1, the more intense the statistical relationship between the two. Correlations above 0.7 appear in red, while those between 0.5 and 0.7 are shown in yellow.
For instance, the correlation between the presence of executives and the proportion of votes for lists headed by the UMP and its allies – while always positive and generally high – varies in non-negligible proportions : from just 0.5 in Paris (where, furthermore, it masks very different electoral attitudes among executives in the private and public sectors) to 0.82 in Bordeaux (where Modem and the UMP fielded a shared list in the first round of the elections ; the fact that the correlation here was higher than in other cities may indicate that it pays to adopt a united approach). Similarly, the presence of manual workers is associated sometimes with high levels of abstention (as in Lyon and Toulouse), sometimes with high scores for lists headed by the PS (as in Lille and Bordeaux) – or, conversely, particularly low scores for these lists (as in Strasbourg) – and sometimes with both a high abstention rate and high scores for left-wing lists (as in Nantes and Marseille).
To understand these differences, it should be noted that the indicators used here (“executives”, “manual workers”, etc.) to establish the social affiliations of inhabitants are homogenising categories of analysis, which conceal internal divisions (e.g. between skilled and unskilled manual workers, or between public-sector and private-sector executives) that play a major role in the construction of voting trends. Consequently, “manual workers” in Lille are probably not the same as “manual workers” in Montpellier. Above all, though, the significance of these categories and their influence on voting habits varies in spatial terms, both geographically and socially speaking. In other words, being a skilled manual worker who lives in a Parisian neighbourhood populated essentially by executives does not lead to the same self-perception or the same political and electoral dispositions as being a skilled manual worker living among other manual workers in an industrial town like Lens.
More fundamentally, conducting an analysis on the scale of polling districts and using data relating to the geography of social inequality clearly reaffirms the primacy of explanations of electoral behaviour based on social positions in their contexts, far removed from theories that rely on crude and reductive sociological categories (whether these be “bobos” or “low-income whites”) or essentialist geographical categories (such as “city-dwellers” or “suburbanites”).
Bibliography
- Braconnier, Céline and Dormagen, Jean-Yves. 2007. La Démocratie de l’abstention. Aux origines de la démobilisation électorale en milieux populaires, Paris : Folio.
- Girard, Violaine and Rivière, Jean. 2013. “Grandeur et décadence du ‘périurbain’. Retour sur trente ans d’analyse des changements sociaux et politiques”, Métropolitiques, 3 July (also available in English).
- Rivière, Jean. 2012. “Vote et géographie des inégalités sociales : Paris et sa petite couronne”, Métropolitiques, 16 April (also available in English).
- Rivière, Jean and Tissot, Sylvie. 2012. “La construction médiatique des banlieues. Retour sur la campagne présidentielle de 2007”, Métropolitiques, 7 March (also available in English).
- Tissot, Sylvie. 2013. “Une vision pernicieuse du monde social et de ses divisions”, L’Humanité, 21 June.
Annex : Characteristics of polling-district categories